Hyperspectral Imaging for E-Waste: Edge AI Sorting
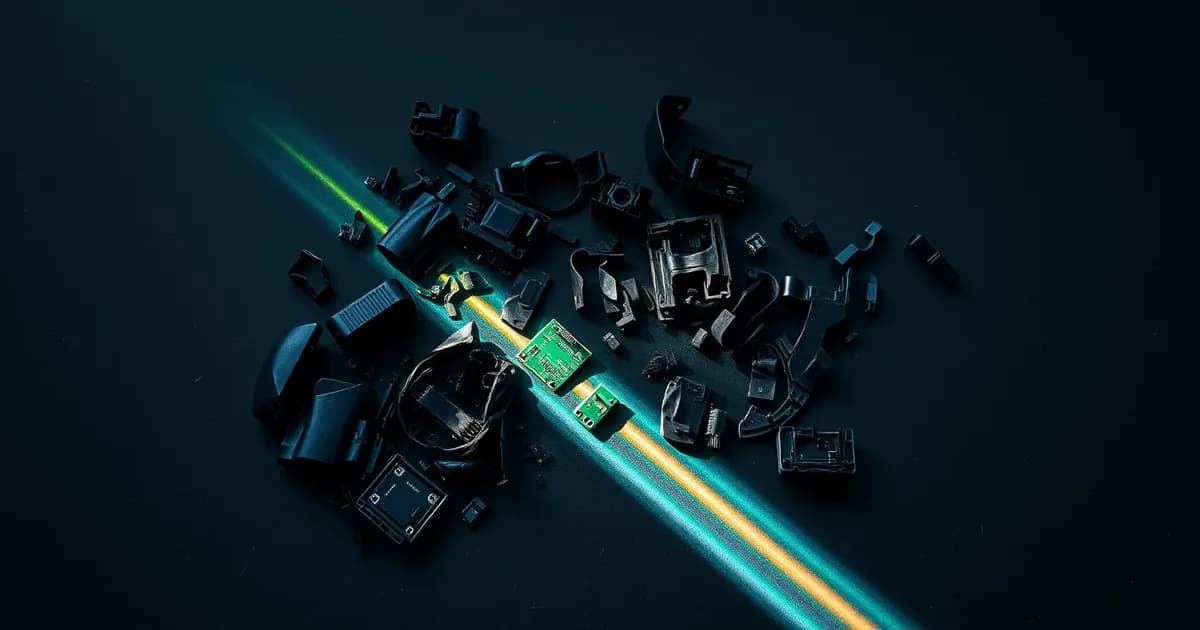
In 2022 the world generated 62 million tonnes of electronic waste, and only 22.3% was documented as properly collected and recycled. The figures come from the United Nations' Global E-waste Monitor 2024, which projects 82 million tonnes by 2030 and a documented recycling rate slipping towards 20%. For anyone running a treatment plant, the bottleneck is not the supply of material but the ability to recognise it: a colour camera sees shapes and shades, not chemistry. Two fragments of black plastic that look identical may be different polymers, one of them loaded with brominated flame retardants that rule out reuse. This is where hyperspectral imaging for e-waste, paired with on-machine processing, changes the economics of sorting: it moves the decision from "what does it look like" to "what is it made of", in real time and without relying on the cloud.
Hyperspectral imaging for e-waste: what it actually measures
An RGB camera records three values per pixel. A hyperspectral camera records hundreds: for every point in the scene it captures an almost continuous reflectance spectrum, split into narrow, contiguous bands. The result is a data "cube" with two spatial dimensions and one spectral dimension, in which each material leaves a recognisable signature tied to its chemical bonds.
Plants almost always use line-scan (pushbroom) sensors: the camera frames a single line across the belt, and the movement of the material builds the image line by line. The architecture fits naturally with conveyor transport and with pneumatic ejection downstream, but it comes with strict constraints: stable, broadband illumination, periodic calibration against white and dark references, and synchronisation between line rate and belt speed.
The spectral bands that matter: VNIR, SWIR and MWIR
The choice of spectral range determines what the plant can tell apart, and it weighs heavily on the cost of the sensor.
- VNIR (roughly 400–1000 nm): visible and near infrared. Useful for colours, metal surfaces and coatings; this is the range of the most affordable sensors.
- NIR/SWIR (roughly 900–2500 nm): the range in which polymers show characteristic absorptions. It underpins optical sorting of light and coloured plastics.
- MWIR (roughly 3–5 µm): the mid-wave infrared, required for black plastics.
The near infrared fails on black plastics for a physical reason: the carbon black used as a pigment absorbs most of the incident radiation, so the signal reflected by the polymer becomes too weak to classify. In the mid-wave infrared, absorption signatures remain readable. Industrial hyperspectral cameras built for this purpose cover the 2.7–5.3 µm range, and the manufacturer states they can discriminate PS, PE, PP, ABS, PVC, black plastics and some additives such as flame retardants. For e-waste streams, where dark housings are the norm, that is a decisive step.
Brominated plastics and PCB components: what the research says
On the plastics side, a study published in 2021 in the journal Recycling examined ABS and PS scraps from cathode ray tube monitors and televisions using SWIR spectroscopy (1000–2500 nm), with X-ray fluorescence as the reference for bromine content and a 2000 mg/kg threshold separating the classes. With a PLS-DA classifier, recognition of high- and low-bromine samples came in at around 88–90%. The authors also flag the limits: a small sample (36 scraps, a single stream) and recurring confusion between PS and ABS, particularly on low-reflectance samples.
On the circuit board side, the public PCB-Vision dataset, produced by Helmholtz-Zentrum Dresden-Rossendorf, provides 53 boards captured both in RGB and with a 224-band VNIR hyperspectral camera (400–1000 nm), with annotations for integrated circuits, capacitors and connectors and baseline results obtained with segmentation networks from the U-Net family.
A third paper, published in Applied Sciences, shows the value of sensor fusion: by combining a NIR hyperspectral camera (900–1700 nm, 224 bands) with a structured-light 3D scanner, classification of board components reached an overall accuracy of 98.24%, against 88.65% for spectral data alone with an SVM. The lesson is a practical one: the spectral signature tells you what material an object is made of, while geometry tells you what the object is.
From data cube to decision: the edge AI pipeline
A hyperspectral cube is heavy: hundreds of bands for every pixel, on every line, for every second of belt travel. Sending it to a remote server is incompatible with line timing, where the window between acquisition and ejection is measured in milliseconds. Processing has to happen next to the sensor, and the typical pipeline has four stages:
- Radiometric correction: converting the raw signal into reflectance using the white and dark references.
- Dimensionality reduction: selecting the informative bands or projecting with techniques such as PCA, to cut the computing load without losing discriminating power.
- Classification: from chemometric models such as PLS-DA to neural networks working on the single spectrum or on combined spatial and spectral features.
- Actuation: translating the class map into commands for air nozzles or picking robots.
On the hardware side, embedded GPU modules now offer adequate headroom. In the NVIDIA Jetson Orin family, the range runs from the Orin Nano Super kit, rated at 67 TOPS with 8 GB of memory and power profiles between 7 and 25 W, up to AGX Orin, which reaches 275 TOPS within a 15–60 W envelope. These are manufacturer-stated values: real sizing depends on the number of bands actually processed, the line rate and how well the model is optimised.
Operational limits and selection criteria
Before investing, it is worth checking a few points that the literature and suppliers tend to leave in the background:
- Representative data: published results often come from small, clean samples. Dust, labels, and wet or degraded surfaces lower performance and call for datasets collected on your own stream.
- Sensor cost: complexity rises from VNIR to SWIR to MWIR. The range should be chosen for the fraction that generates value, not for maximum coverage.
- Elemental information: reflectance does not measure bromine directly. For critical fractions, hyperspectral imaging is paired with X-ray fluorescence.
- Calibration upkeep: lamp drift and dirty optics alter the spectra; recalibration procedures and model monitoring are needed.
The competitive edge of sorting by material
The value of a recovered fraction depends on its purity, and purity depends on the ability to separate what the eye and the colour camera confuse. Hyperspectral imaging for e-waste, brought to the edge, turns that ability into a continuous process: every fragment is classified by composition, every decision can be logged and traced back to a batch, and every drift in the incoming stream becomes a measurable data point. For a decision maker this means three things: plastic fractions that are easier to sell because they are separated from materials containing unwanted additives, less dependence on manual picking, and a stronger documentary basis towards customers and authorities. The sensible path starts small: a test bench on a real stream, a spectral range chosen for the most critical fraction, a model validated on your own samples. Those who start building their own archive of spectral signatures today will find themselves tomorrow with a data asset that competitors cannot buy off the shelf.